Mobile Broadband Traffic
Lithuania
Mobile Broadband Traffic: How often are mobile phone users connecting on 4G, 5G-SA, and 5G-NSA, as opposed to connecting on 2G and 3G, or receiving No Signal whatsoever?
Unlike other mobile traffic metrics, M2’s analysis does not take payload into consideration because of its potential to bias the analysis (faster networks allow greater data flow). We focus solely on the percentage of measurements categorized by network connection type and the associated cell identities with those measurements from the M2 dataset. Our Cell ID counts are the count of unique Cell IDs by Mobile Network Operator (MNO), Network Type, and Country from our crowdsourced dataset.
Table 1. Lithuania Cell ID Counts by MNO on 4G & 5G Network Types
Key Findings for Table 1.
• Table 1 displays the number of unique Cell IDs newly observed between January and June 2023 and those newly observed between July and December of 2023. As a reference, historically observed Cell IDs dating 18 months prior to July 2023 are also included. Newly observed Cell IDs can be attributed to either new hardware deployed by MNOs or an expansion in the footprint of our dataset.

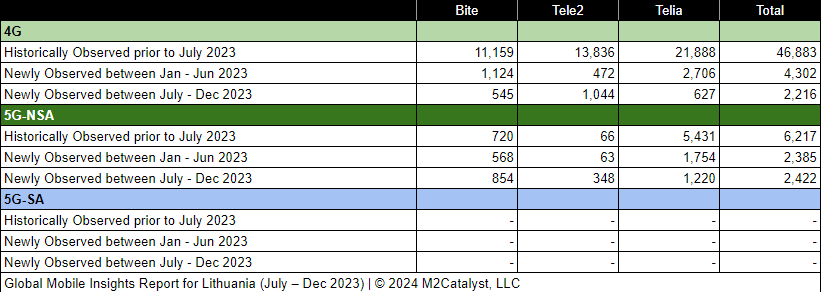
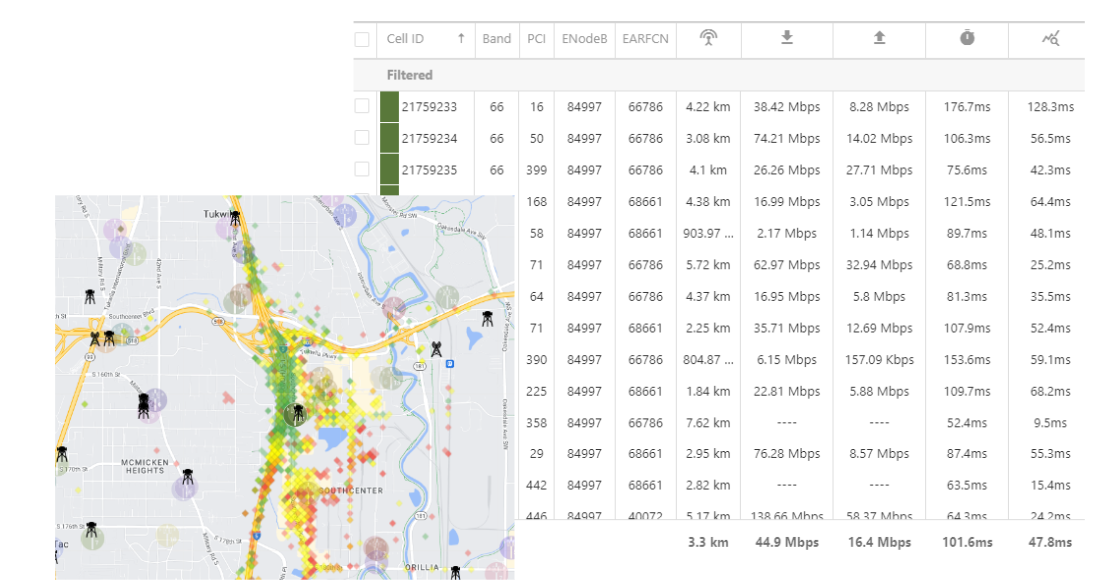
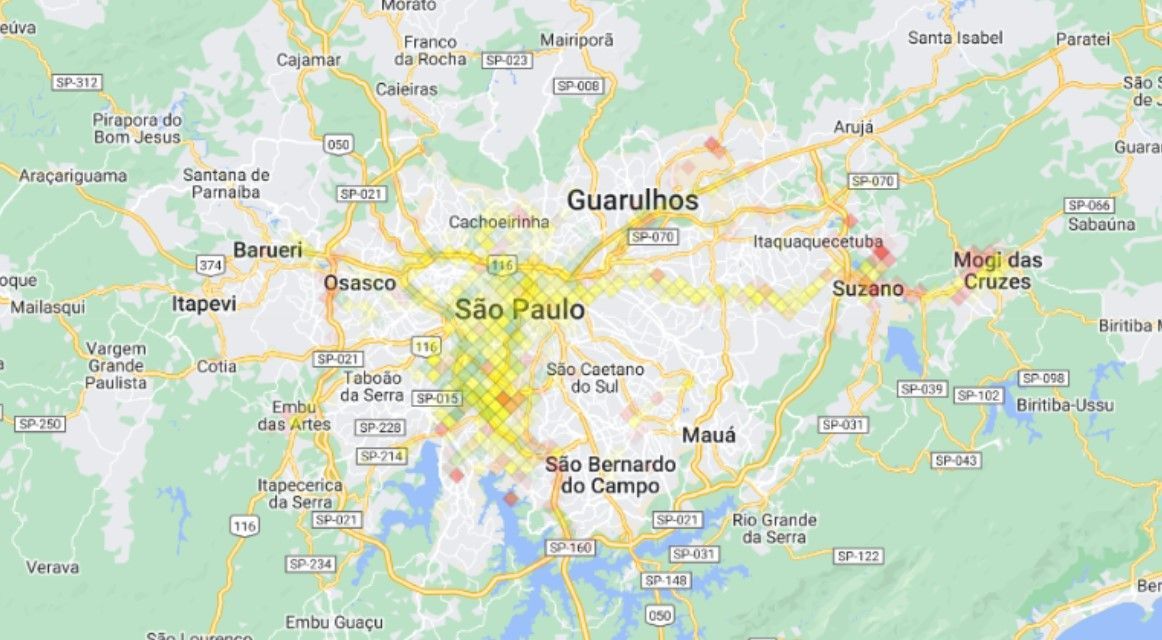
• M2’s dataset for the 2nd half of 2023 contains 4,638 newly observed 4G/5G mobile broadband Cell IDs. A more in-depth view of the Cell IDs and their associated details by location over time can be visualized on M2's Crowd SiteIntel platform.

• No progress has been detected towards increasing deployment on the 5G-SA network.
Table 2. Lithuania Percentage of Records by MNO
Chart 1. Lithuania Mobile Traffic Percentage by Network Type
Key Findings for Chart 1.
• Chart 1 displays the percentage of users (across all MNOs in this study) reporting mobile traffic by network types: 5G-SA, 5G-NSA, 4G, 3G, 2G, or no signal.

• The Mobile Traffic percentage by Network Type shows 9% of the mobile connections on 5G-NSA and 84% on 4G.
Chart 2. Lithuania Mobile Traffic Percentage by MNO and Network Type
Key Findings for Chart 2.
• Chart 2 displays the percentage of mobile traffic by MNO and network type.

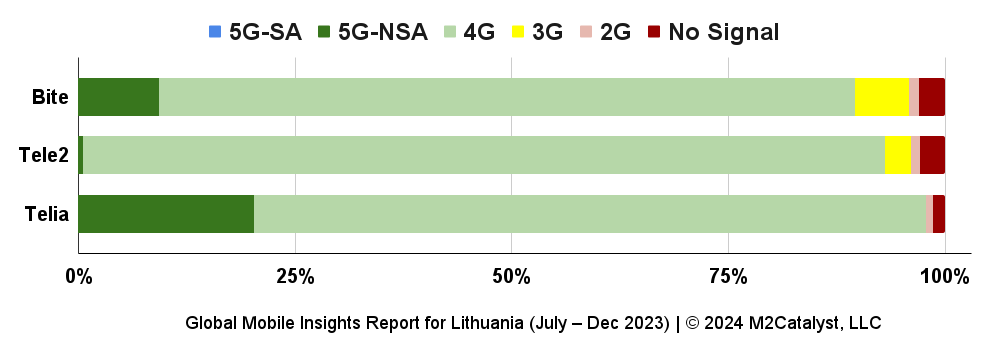
• Bite and Tele2 show 3% of their users reporting no signal while Telia has only 1% of their users reporting no signal.

• Bite and Tele2 show users reporting on the 3G network type with Bite reporting the highest percentage of 6%.

• Telia has 98% of its users reporting on a network type of 4G or higher while Bite and Tele2 are at 90% and 93%, respectively. Telia has the greatest percentage of users reporting on 5G.
Chart 3. Lithuania Mobile Traffic Percentage on 5G by Reporting Period
Key Findings for Chart 3.
• Chart 3 displays the percentage of users reporting 5G-SA and 5G-NSA network types over different reporting periods.

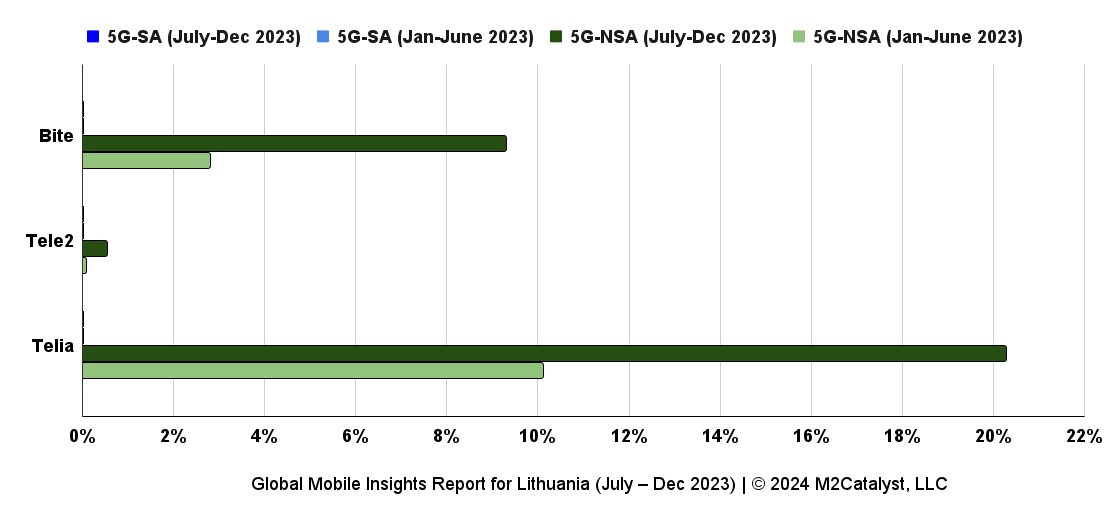
• Bite has more than tripled the amount of traffic on its 5G-NSA network.
Your Next Step
As part of our suite of solutions, M2 offers Crowd SiteIntel (CSI), a powerful data analytics and visualization platform capable of identifying competing MNO cell site locations with an AI-generated Global PoP database or identifying coverage footprints of current cell sites to predict network densification needs. Experience the capabilities of Crowd SiteIntel today.

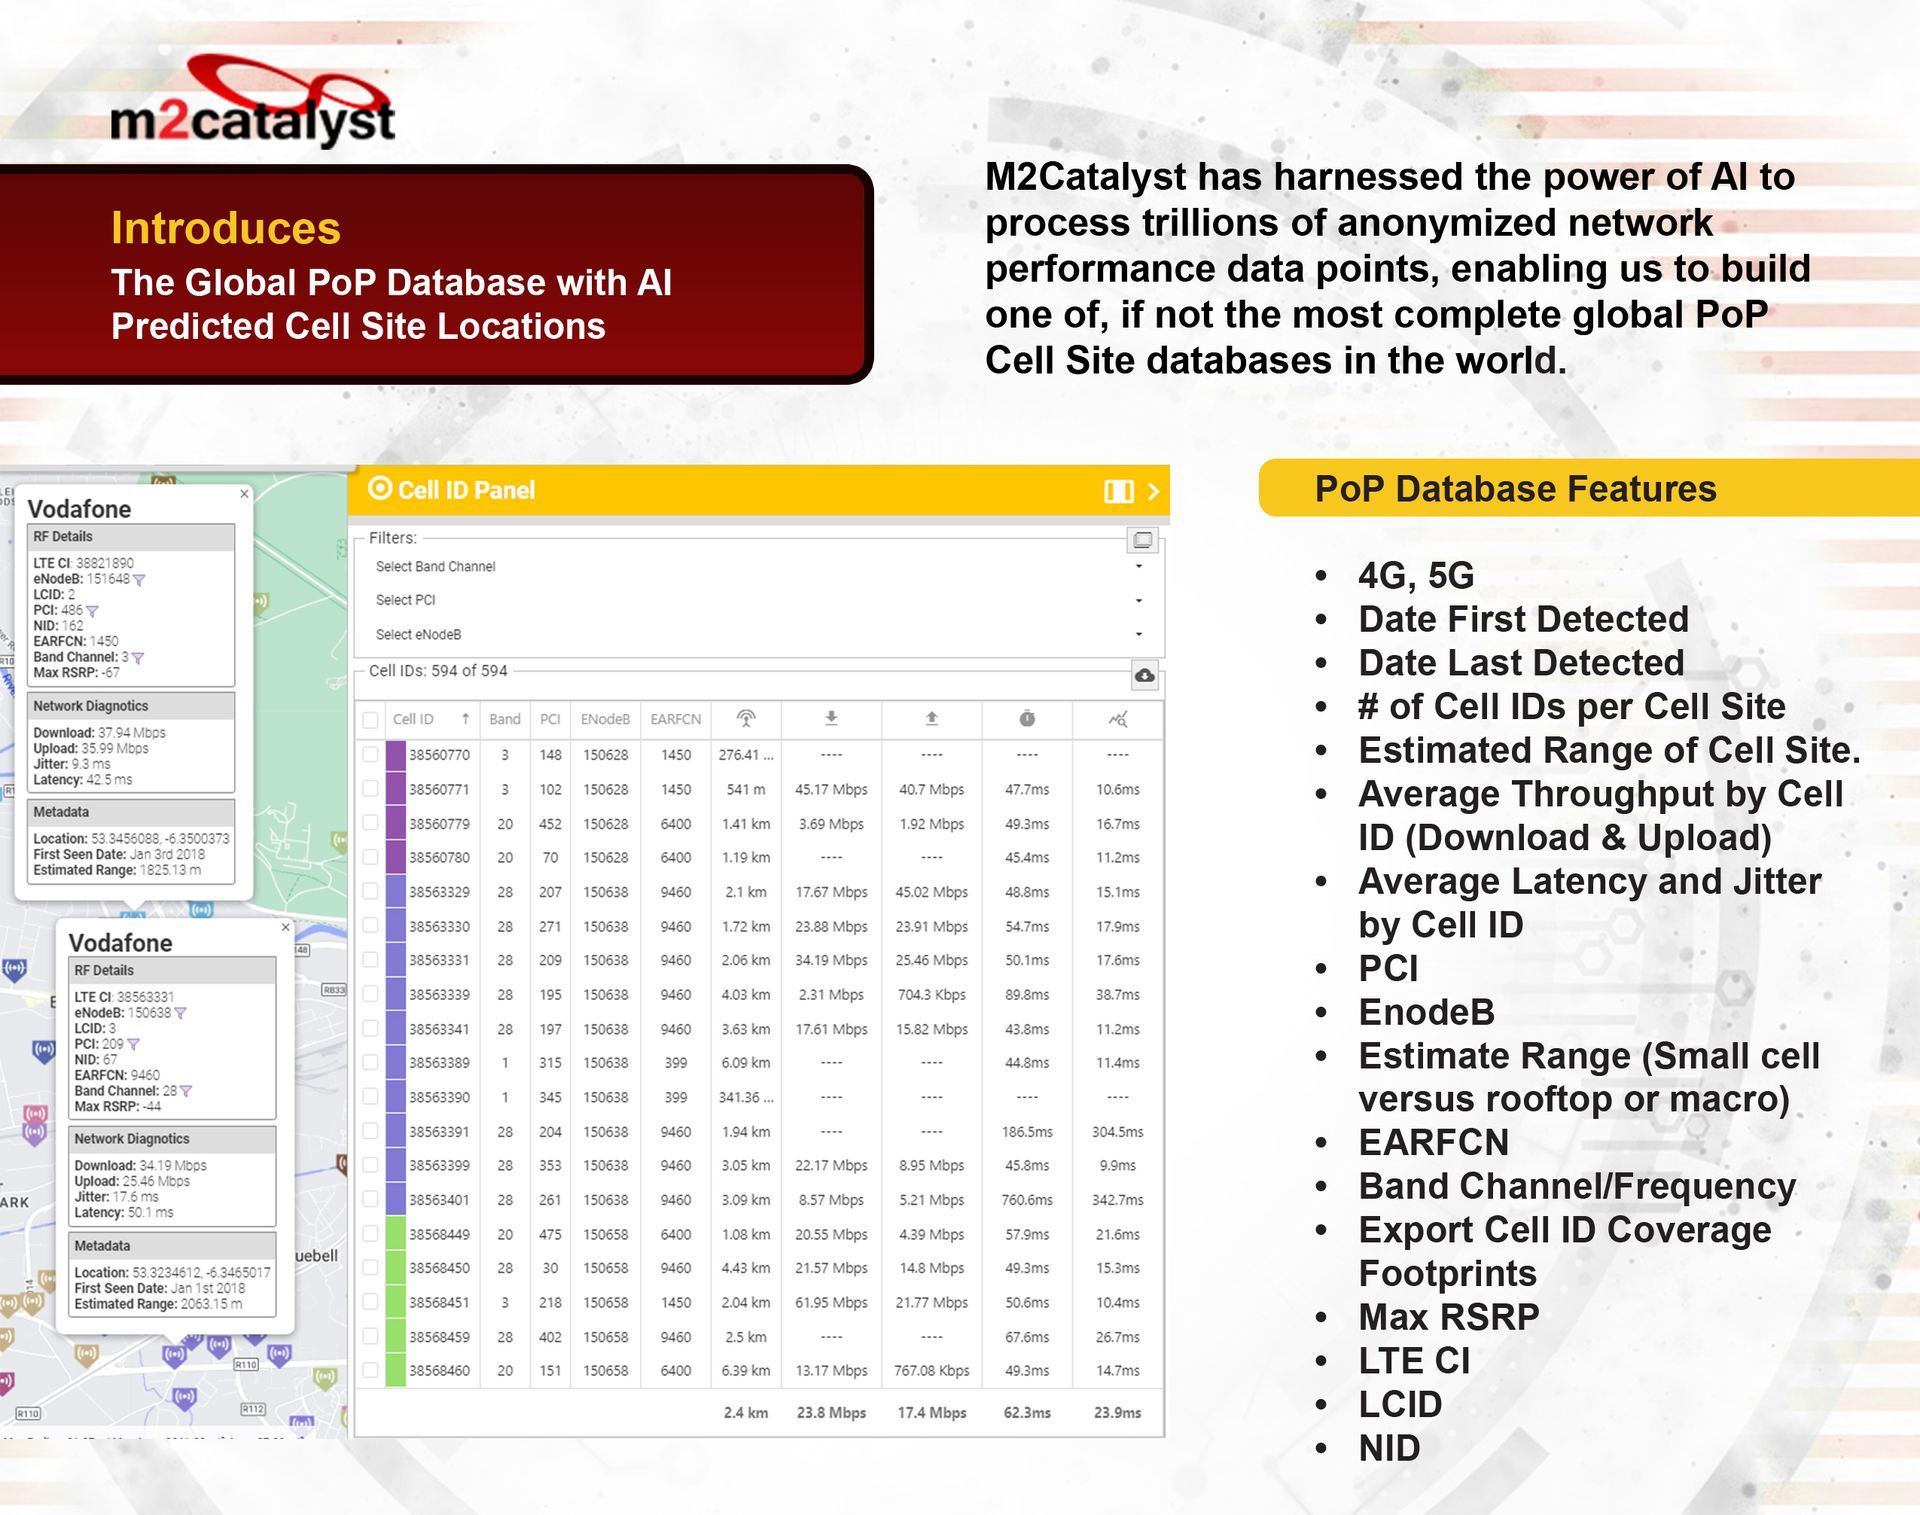
Schedule a demo on how to identify competing MNO cell site locations with the CSI AI-generated Global PoP database.
Learn how to Identify coverage footprints of current cell sites to predict network densification needs using the Crowd SiteIntel platform.
Utilize the CSI to monitor where and when MNOs deploy their licensed spectrum.
Study Methods:
The extensive dataset for this global study, comprising hundreds of billions of records, was collected between July 1 and December 31, 2023 from mobile applications installed on millions of mobile devices. All data collection was carried out in accordance with our privacy policy, with explicit permission obtained from the owners of the mobile devices.


Right to Republish M2 Reports

The M2 Crowdsourced Data, which has been developed, collected, aggregated, assembled, formatted, and supplied by M2 through the application of methods and standards of judgment developed and applied through the expenditure of substantial time, effort, and money, constitute confidential and valuable industrial property and trade secrets, and are protected by United States copyright laws and international treaty provisions as well as other intellectual property laws and treaties. All title and copyrights in and to the M2 Crowdsourced Data and any accompanying printed materials are owned by M2.

The M2 Crowdsourced Data may not be used as a component of or as a basis for any material offered for sale, license, subscription, or promotion.

M2Catalyst, LLC also retains full ownership of this M2 Mobile Broadband Quality report, encompassing all intellectual property rights, data, content, graphs, and analysis. Unauthorized quoting, reproduction, distribution, or publication for commercial use is prohibited without M2Catalyst's prior written approval. Journalists wishing to cite information from our reports must provide clear source attribution and secure prior written consent from M2Catalyst. For further information or clarification, please contact us at info@m2catalyst.com.


Learn more about the methodology and rights to republish for this report.


Contact us at any time

Contact Us

Share by: