M2CATALYST GLOBAL MOBILE INSIGHTS REPORT
Country Report Directory
COVERAGE-QoE / TRAFFIC ANALYSIS / DIGITAL DIVIDE
January - June 2023
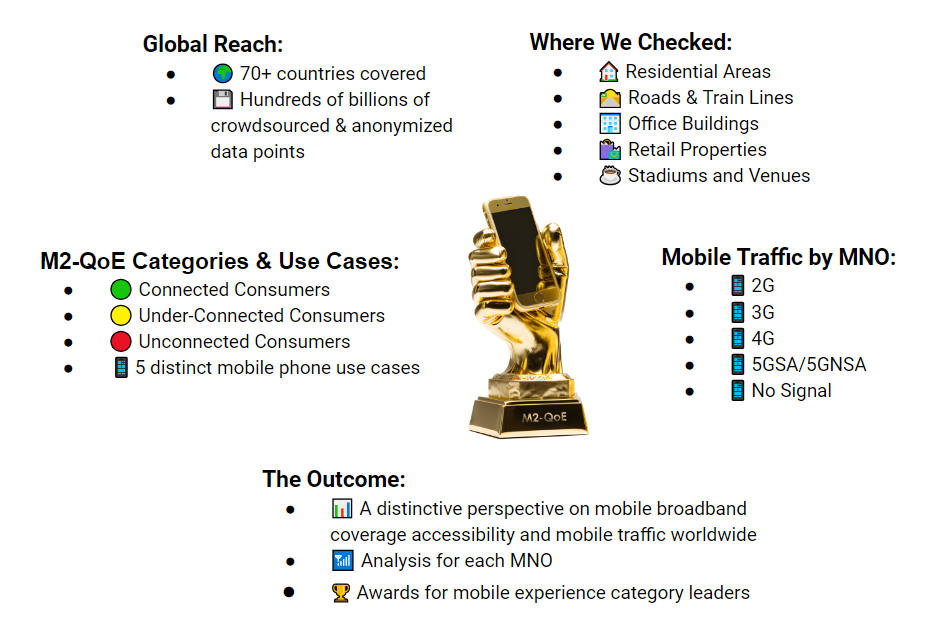
This global study examines both the mobile quality of experience, as measured by M2Catalyst’s proprietary coverage accessibility algorithm, and the percentage of mobile traffic carried by each network technology on an MNO-by-MNO basis for 70+ countries. Analysis of these metrics enables an enhanced understanding of the digital divide of the subject country.
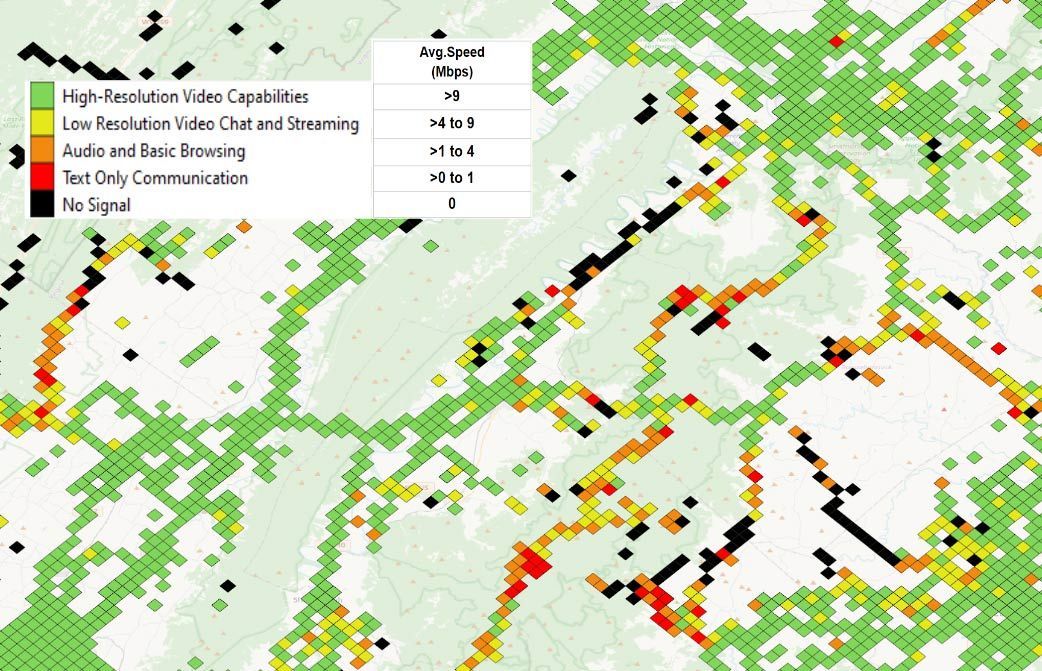
The M2 Coverage-QoE algorithm was developed by M2Catalyst in conjunction with industry-leading RF engineering consultants. It takes into consideration numerous elements including signal strength, signal quality, and throughput from the 4G/5G service footprint for each country’s national MNOs, the 2G/3G-only service footprint for each MNO, and the areas where mobile devices are used but have detected no service. Each 800m x 800m bin with mobile activity is then classified as to the highest mobile use case (see below) it can support, leading to its further categorization as Connected, Under-Connected, or Unconnected.

“The M2 crowdsourced data is so robust that we’ve been able to create the M2 Coverage-QoE algorithm which simplifies the process of identifying and predicting network performance characteristics. This means all the heavy lifting is taken care of so that mobile operators, tower companies, government authorities and others can immediately gain insights and move faster into triage and prioritization.”
- Martin Donnelly
With 20+ years of experience, Martin has specialized in establishing and overseeing wireless networks in Europe and the USA. Rooted in data analysis and automation, he's been pivotal in launching one of the telecom industry's premier big data platforms.
“The M2 Coverage-QoE offers a straightforward gauge of wireless broadband quality, designed for clarity even to non-tech users. We have worked extensively with M2 to build this advanced algorithm using RF traits like signal strength, quality, and throughput. The result is an algorithm that predicts the true user experience, factoring in more than just speed.”
- Eric Law
Eric has specialized for 30 years in RF Engineering, Planning, Design, and Operations. His expertise includes big data and crowdsourced analysis, bolstered by spatial analysis skills.
Data Collection:
The hundreds of billions of network performance measurement that constitute the data for this study were collected from M2Catalyst mobile applications installed on mobile devices during the period of January 1 through June 30, 2023. All such data collection was performed with the express permission of the mobile device owners.New Paragraph

Coverage-QoE
Coverage-QoE: Where are people trying to use their smartphones, but do not have access to a strong enough 4G/5G mobile broadband signal to support remote work, education, and telemedicine?
Chart #1
This Chart shows, on a country-by-country basis, the percentage of locations with 4G/5G availability that were able to attain average throughput of 9 Mbps or faster. The median for the 72 countries studied is 86%, with a range of 14% (Venezuela) to 98% (The Netherlands and South Korea).

Chart #2
This Chart shows, on a country-by-country basis, the percentage of locations where mobile subscribers have connections, but they’re sub-optimal, i.e., they’re unable to access high-res video. The median for the 72 countries studied is 11%, with a range of 11% (South Korea) to 46% (Venezuela).

Chart #3
This Chart shows, on a country-by-country basis, the percentage of locations where mobile subscribers are trying to use their phones, but have no connectivity. The median for the 72 countries studied is 3%, with a range of <1% (Finland and The Netherlands) to 42% (Ecuador).

Mobile Traffic
Mobile Traffic: How often are mobile phone users connecting on 4G, 5G-SA, and 5G-NSA, as opposed to connecting on 2G and 3G, or receiving No Signal whatsoever?
Chart #4
This Chart shows, on a country-by-country basis, the percentage of mobile traffic that travels on 4G/5G networks. The median for the 72 countries studied is 89%, with a range of 43% (Venezuela) to 98% (South Korea).

Chart #5
This Chart shows, on a country-by-country basis, the percentage of mobile traffic that travels on 2G/3G networks. The median for the 72 countries studied is 8%, with a range of <1% (United States) to 37% (Venezuela).

Chart #6
This Chart shows, on a country-by-country basis, the percentage of mobile traffic that reports No Signal. The median for the 72 countries studied is 3%, with a range of 1% (10 countries) to 32% (Libya).

In Summary
What will it take to bridge the Digital Divide?
This global mobile insights report examines the Coverage-Quality of Experience, a location based metric as measured by M2Catalyst’s proprietary coverage accessibility algorithm, in juxtaposition to the percentage of mobile traffic carried by each network technology in 70+ countries. The Coverage-QoE algorithm provides a novel new approach to calculating the estimated throughput for each location based on RF conditions, and provides an important step forward in bridging the Digital Divide. In rural, remote, and disadvantaged urban markets, consumers should not be expected to pay the heavy price of data for running speed tests to prove they have poor connectivity. The Coverage-QoE algorithm eliminates the need for running speed tests in regions where consumers can't afford the incremental data charges. The Coverage-QoE analysis provides a new take on the state of the Digital Divide. We calculate the number of locations (800m x 800m bins) countrywide, on an MNO-by-MNO basis, where people have no connectivity or they’re under-connected, and therefore unable to perform remote work, access educational opportunities, or avail themselves of the convenience of telemedicine.
Charts #1 through #3 show, on a country-by-country basis, the percentage of 800m x 800m bins that are Connected, Under-Connected, and Unconnected, all as defined at the top of this report. Charts #4 through #6 show, on a country-by-country basis, the percentage of mobile traffic that travels over 2G/3G, 4G/5G, or reports No Signal. The global report includes totals for Coverage-QoE and Mobile Traffic across each country’s MNOs. For an MNO-by-MNO analysis, please refer to the individual country reports completed in the Americas, APAC, European, and Middle East & African Regions.
Chart #1 shows 23 countries with 90% of locations reporting a Connected Coverage-QoE (the percentage of locations with 4G/5G availability that were able to attain average throughput of 9 Mbps or faster) while Chart #4 shows 34 countries with 90% of its users on 4G/5G mobile traffic. While more countries have mobile traffic on the 4G/5G networks, not all provide the throughput speeds to be able to effectively complete tasks such as remote work or telemedicine.
From Charts #1 through #6, we can see that countries within the European Region are currently more successful at bridging the Digital Divide than those in the other regions. Europe has the most countries with 90% of locations reporting a Connected Coverage-QOE followed by the APAC, Middle East & African, and Americas Regions. Within the Americas Region, countries located in South America appear to have the most room for improvements.
For access to the complete report in PDF format, please click below.
Right to Republish M2 Reports
The M2 Crowdsourced Data, which has been developed, collected, aggregated, assembled, formatted, and supplied by M2 through the application of methods and standards of judgment developed and applied through the expenditure of substantial time, effort, and money, constitute confidential and valuable industrial property and trade secrets, and are protected by United States copyright laws and international treaty provisions as well as other intellectual property laws and treaties. All title and copyrights in and to the M2 Crowdsourced Data and any accompanying printed materials are owned by M2.
The M2 Crowdsourced Data may not be used as a component of or as a basis for any material offered for sale, license, subscription, or promotion of its business.
M2Catalyst, LLC also retains full ownership of this M2-QoE report, encompassing all intellectual property rights, data, content, graphs, and analysis. Unauthorized quoting, reproduction, distribution, or publication for commercial use is prohibited without M2Catalyst's prior written approval. Journalists wishing to cite information from our reports must provide clear source attribution and secure prior written consent from M2Catalyst. For further information or clarification, please contact us at info@m2catalyst.com.
Learn more about the methodology and rights to republish for this report.
Coverage-QoE CSV Exports Available for 200+ Countries
Coverage-QoE CSV exports can provide detailed insights for any specific MNO or group of MNOs, or for all MNOs across more than 200 countries. These layers are optimized for integration into network planning and GIS tools, including Esri ArcGIS and similar platforms.
Key Features:
- Connected: Visualize areas where MNOs achieve an average throughput speed of 9 Mbps or higher, suitable for high-resolution video streaming.
- Under-Connected: Filter and pinpoint locations optimized for specific connectivity needs, such as low-resolution video, audio-only, or text-based communication.
- Unconnected: Identify regions where specific MNOs register no signal, highlighting areas of connectivity gaps.

For a demo and a detailed discussion on your data configuration requirements, please contact us at:

