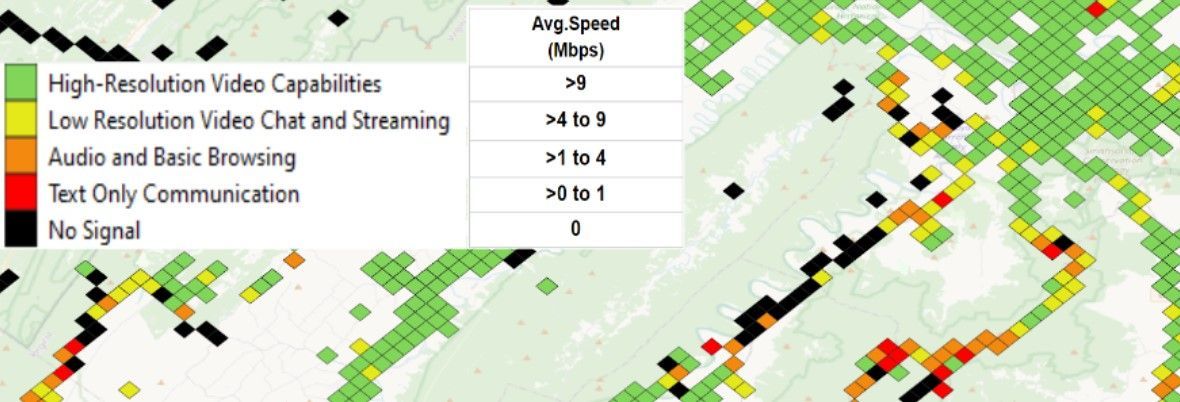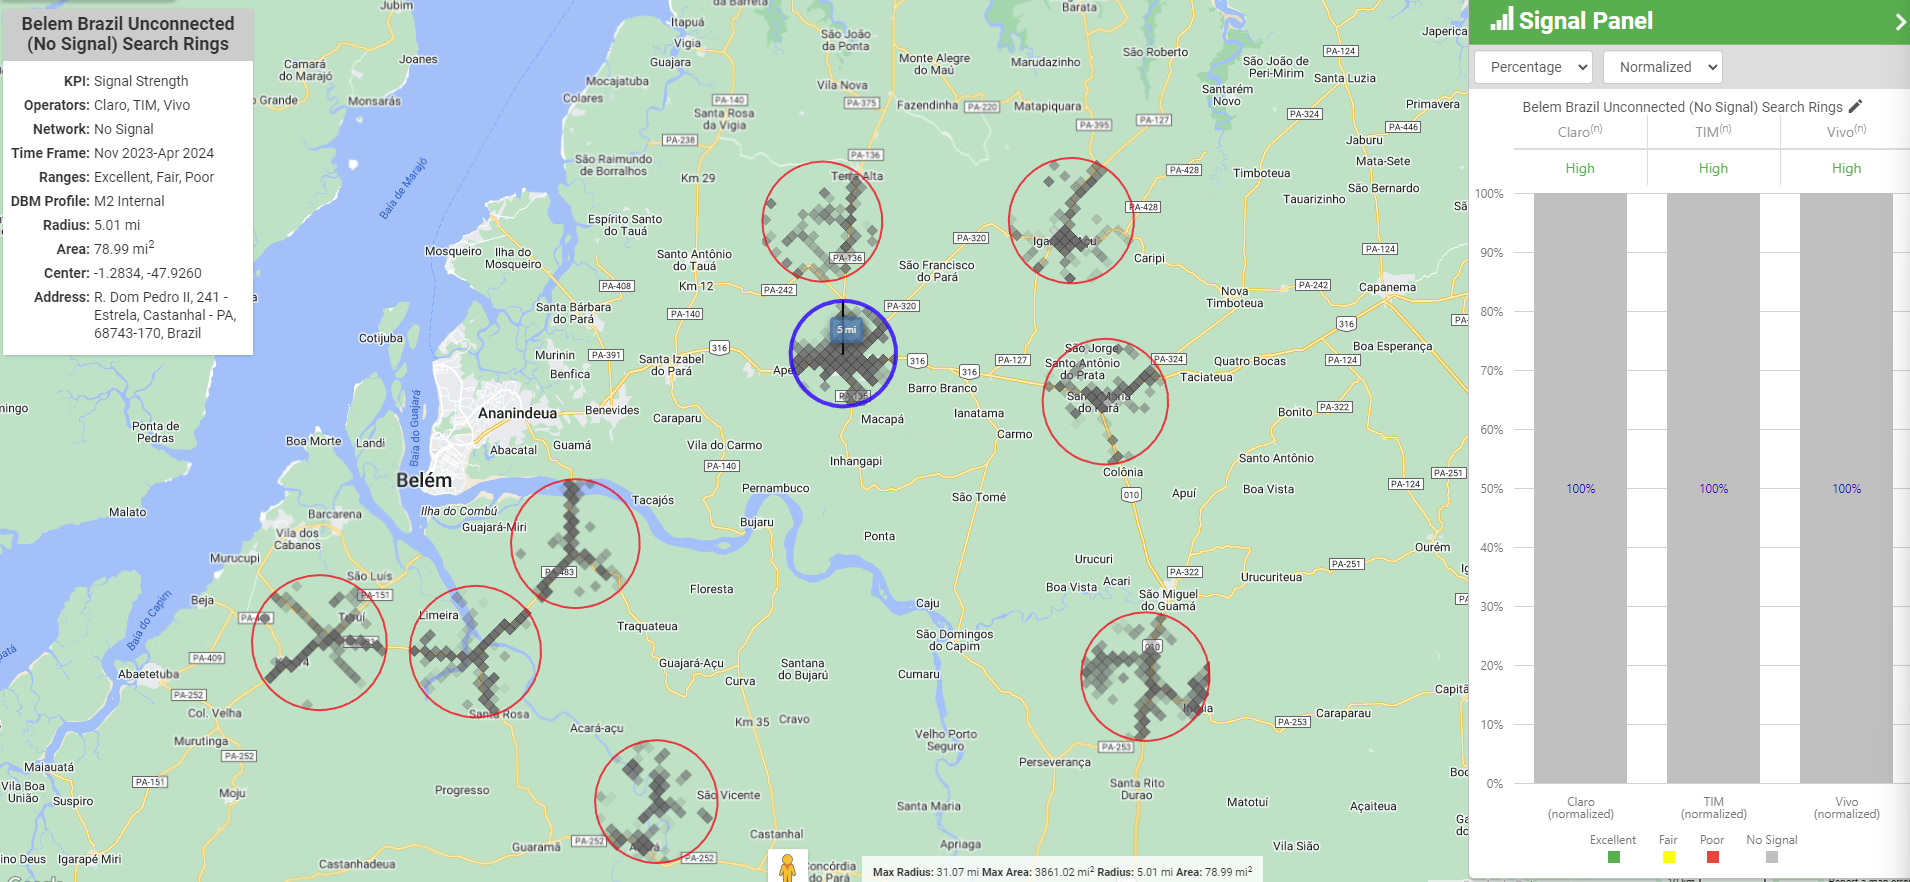
• This study identified a minimum of 32,910 and a maximum of 89,141 unconnected bins (Dead Zones aka Not-Spots), depending on the degree of overlap. This represents between 21% and 56% of the unique bin count (locations reporting at least one quality reading from any of the MNOs in the study).
• This study identified a minimum of 53,296 and a maximum of 120,912 under-connected bins, depending on the degree of overlap. This represents between 34% and 77% of the unique bin count.
• Mobile Broadband Quality data layers including under-connected locations where some users are experiencing poor service on a 4G network type are available as CSV exports. Coordinates and mapping of the Dead Zones are available on M2's Crowd SiteIntel platform.


• Tigo and Claro have the greatest connected location percentages at 50% and 42%, respectively.
• WOM and Tigo has the lowest under-connected location percentages at 27% and 29%, respectively, while the other MNOs range between 39% and 45%.
• Claro has the lowest Dead Zone location percentage at 19%, while the other MNOs range between 21% and 39%.


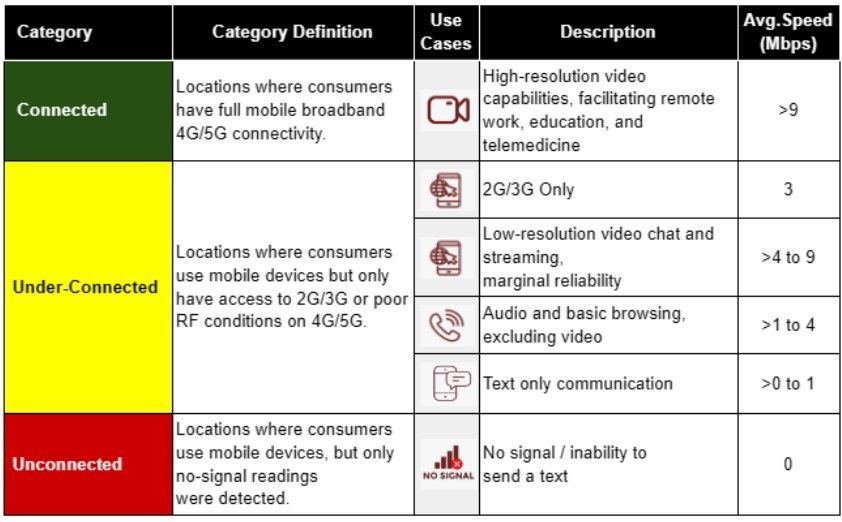
M2’s proprietary Mobile Broadband Quality algorithm comprehensively evaluates various factors, including signal strength, signal quality, and throughput, across (1) the 4G/5G service footprint for each country's national Mobile Network Operators (MNOs), (2) the 2G/3G-only service footprint for each MNO, and (3) areas where mobile devices are active but unable to detect any service. Within the M2 dataset, each 1km bin with mobile activity is then assessed to determine the highest mobile use case it can support, resulting in its classification as Connected, Under-Connected, or Unconnected.

Right to Republish M2 Reports
The M2 Crowdsourced Data, which has been developed, collected, aggregated, assembled, formatted, and supplied by M2 through the application of methods and standards of judgment developed and applied through the expenditure of substantial time, effort, and money, constitute confidential and valuable industrial property and trade secrets, and are protected by United States copyright laws and international treaty provisions as well as other intellectual property laws and treaties. All title and copyrights in and to the M2 Crowdsourced Data and any accompanying printed materials are owned by M2.
The M2 Crowdsourced Data may not be used as a component of or as a basis for any material offered for sale, license, subscription, or promotion.
M2Catalyst, LLC also retains full ownership of this M2 Mobile Broadband Quality report, encompassing all intellectual property rights, data, content, graphs, and analysis. Unauthorized quoting, reproduction, distribution, or publication for commercial use is prohibited without M2Catalyst's prior written approval. Journalists wishing to cite information from our reports must provide clear source attribution and secure prior written consent from M2Catalyst. For further information or clarification, please contact us at info@m2catalyst.com.
Learn more about the methodology for this report.

